Calculate WACC in Excel: a practical guide to calculate wacc excel
Alright, let's get down to business. Calculating the Weighted Average Cost of Capital (WACC) in Excel isn't just a number-crunching exercise. Once you’ve gathered your key inputs, you're essentially building a formula that blends the cost of your equity with the after-tax cost of your debt, all weighted by how much of each you're using. This is where financial theory gets real—and really useful.
Why Mastering WACC in Excel Is a Game Changer
Before we even open a spreadsheet, let's be clear on why this matters. WACC isn't just another bit of financial jargon; it's the minimum return a company has to earn to create value for everyone who's put money into it—shareholders and lenders alike. It’s the average cost of all the capital the business uses to keep the lights on and grow.
Knowing how to calculate WACC in Excel gives you a dynamic tool for serious financial analysis. A solid, well-built model lets you sanity-check project ideas, perform company valuations, and make much smarter decisions about where to put your money. For freelancers or small business owners, this takes you way beyond a simple P&L, offering a far more sophisticated look at your financial health.
The Practical Power of a WACC Calculation
Think of WACC as your company’s financial high-jump bar. If a new project promises an 8% return, but your WACC is 10%, that project is a net loss. It might look profitable on paper, but it’s actually destroying value because it's not clearing the bar.
This single number is essential in a few key situations:
- Investment Decisions: It’s your go-to for deciding whether to buy new equipment, roll out a new product, or even acquire another company.
- Company Valuation: WACC is the discount rate at the heart of any Discounted Cash Flow (DCF) analysis, which is how you figure out what a company is truly worth today.
- Performance Measurement: It acts as a benchmark. Are you consistently beating your WACC? If so, you're creating value. If not, something needs to change.
WACC is the bridge between how your company is funded and its ability to generate wealth. It answers the one question that really matters: "Are our investments making enough money to cover the cost of raising it?"
The real-world impact of this metric is especially clear in regulated industries. A 2014 study of utility companies in the Luxembourg region, for instance, showed just how much WACC fluctuations can shake up financial models. It found that the nominal after-tax WACC dropped from 5.2% in 2011 to 4.2% in 2013. That's a huge shift that completely reset expectations for investment returns. If you're interested, you can dig into the detailed findings on WACC for regulated activities to see exactly how these calculations play out in practice.
Gathering the Raw Materials for Your WACC Calculation
Before you even touch a single cell in Excel, you need to go on a data hunt. The WACC formula is deceptively simple, but its accuracy hinges entirely on the quality of your inputs. A bad input leads to a bad output—it’s that straightforward. Let's walk through how to source each piece of the puzzle, focusing on publicly available information.
Your mission is to find the values for this classic formula:
WACC = (E/V * Re) + (D/V * Rd * (1-Tc))
That means we need to find the market value of equity (E), market value of debt (D), cost of equity (Re), cost of debt (Rd), and the corporate tax rate (Tc).
Nailing Down Market Values and the Tax Rate
Let's start with the low-hanging fruit. The market value of equity, or market capitalisation, is usually the easiest number to find for a public company. Just grab the current share price and multiply it by the total number of shares outstanding. You can pull this straight from financial data providers like Yahoo Finance or Google Finance in seconds.
Next up is the market value of debt. You'll want to head over to the company’s latest balance sheet, found in their annual or quarterly reports. While technically the book value, it’s a widely accepted proxy for the market value unless there's been a massive shift in interest rates since the debt was first issued. For most practical purposes, it gets the job done.
Finally, the corporate tax rate (Tc). This should be the statutory rate for the company's jurisdiction. If you're analysing a business based in Luxembourg, for instance, you'd use the rate set by the government. A crucial tip here: always use the marginal tax rate, not the company's effective tax rate. WACC is a forward-looking metric for evaluating new projects, so you need the rate that would apply to new earnings.
Estimating the Cost of Debt
The cost of debt (Rd) is simply the interest rate a company would have to pay if it borrowed money today. The best-case scenario is finding a recently issued company bond and using its yield-to-maturity (YTM) as your figure.
If that's not available, you can look at the interest rates on its existing bank loans or find the company's credit rating. Once you have the rating (e.g., AA, BBB), you can look up the corresponding yield for bonds with a similar rating.
As a quick-and-dirty method, you can divide the annual interest expense from the income statement by the total debt on the balance sheet. It's not perfect, but it will get you a reasonable pre-tax estimate to start with.
Unpacking the Cost of Equity
Here’s where things get a bit more theoretical. Calculating the cost of equity (Re) is often the trickiest part of the WACC puzzle. The go-to method is the Capital Asset Pricing Model (CAPM), which has its own inputs to track down. For a deeper dive into the theory, our guide on how to calculate the WACC provides more background.
Here's the data you'll need for the CAPM formula:
- Risk-Free Rate (Rf): This is your baseline, the return you'd get from a "riskless" investment. The standard practice is to use the yield on a long-term government bond, like a 10-year Luxembourg government bond.
- Equity Risk Premium (ERP): This is the additional return investors expect for taking on the risk of investing in the stock market instead of sticking with a safe government bond. You don't have to guess this; I highly recommend using the regularly updated data provided by Professor Aswath Damodaran at NYU Stern. He publishes ERP estimates for countries all over the world.
- Beta (β): Beta tells you how volatile a stock is compared to the market as a whole. A Beta of 1.0 means it moves in lockstep with the market. A Beta above 1.0 suggests it's more volatile, while below 1.0 means it's less volatile. Most major financial websites calculate and publish Beta for you.
Before you start building your Excel model, it's a good idea to lay out all your inputs clearly.
WACC Formula Component Checklist
Here's a quick-reference table to keep you organised as you gather your data.
| Component | What It Represents | Where to Find It |
|---|---|---|
| Market Value of Equity (E) | The total value of all the company's outstanding shares. | Share Price × Shares Outstanding (Data from Yahoo Finance, Bloomberg, etc.) |
| Market Value of Debt (D) | The total value of the company's debt obligations. | Company's latest balance sheet (from annual/quarterly reports). |
| Cost of Equity (Re) | The return shareholders require on their investment. | Calculated using CAPM: Risk-Free Rate + Beta × Equity Risk Premium. |
| Cost of Debt (Rd) | The effective interest rate a company pays on its debt. | Yield-to-maturity on existing bonds, interest on bank loans, or yields on similarly-rated corporate bonds. |
| Corporate Tax Rate (Tc) | The statutory tax rate applicable to the company. | Government tax authority websites or financial reports. |
| Risk-Free Rate (Rf) | The return on a zero-risk investment. | Yield on a 10-year or 20-year government bond in the company's country. |
| Beta (β) | A measure of the stock's volatility versus the market. | Financial data providers like Yahoo Finance, Bloomberg, or Reuters. |
| Equity Risk Premium (ERP) | The excess return the market provides over the risk-free rate. | Academic sources (like Damodaran Online) or financial data providers. |
With this checklist complete, you have a solid, defensible foundation. Now, you’re ready to translate this data into a powerful WACC calculation in Excel.
Getting Your Hands Dirty: Building the WACC Calculator in Excel
Now that you've gathered all the raw data, it's time to fire up Excel and start building. A good financial model isn't just about crunching numbers to get the right answer; it's about creating a tool that's clear, logical, and easy to audit. Let’s walk through how to calculate WACC in Excel by structuring your sheet for clarity before we even touch the core formulas.
The best approach, one I’ve seen used countless times in practice, is to divide your workbook into dedicated sections: Inputs, Calculations, and the final Result. This simple separation is a lifesaver. It prevents errors and makes it incredibly easy for you (or a colleague) to follow the logic, even months down the line.
Setting Up Your Spreadsheet for Success
First things first, create a clean "Inputs" section, probably right at the top of your sheet. This is where you'll list every single variable you just sourced—Risk-Free Rate, Beta, Equity Risk Premium, Market Value of Equity, Market Value of Debt, and the Corporate Tax Rate. Just list the name in one column and pop its value in the cell right next to it. This keeps all your assumptions in one place, making them dead simple to update later.
Next, block out a "Calculations" section. Think of this as the engine room. It’s where you’ll translate those inputs into the individual components needed for the WACC formula. It acts as a bridge between your raw data and the final answer, ensuring every step is transparent.
Getting these inputs right is the absolute foundation of an accurate model.
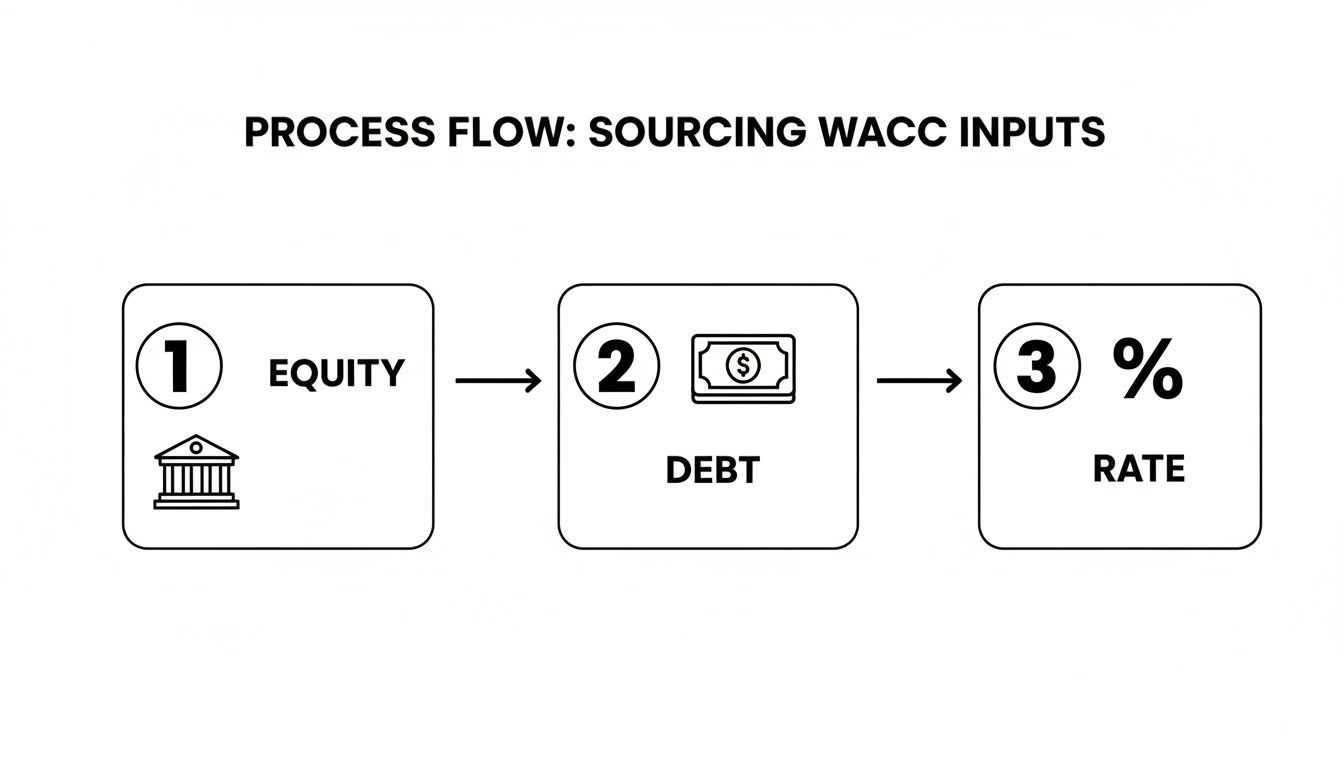
This flow really drives home how important it is to gather the data for equity, debt, and key rates methodically before you start building formulas.
Constructing the Core Formulas
Your first calculation will be the Cost of Equity (Re). Using the CAPM formula, create a cell that pulls from your inputs. For example, if your Risk-Free Rate is in cell B2, Beta is in B3, and the Equity Risk Premium is in B4, your formula will be: =B2 + B3 * B4.
With that done, you can calculate the After-Tax Cost of Debt. If your pre-tax Cost of Debt (Rd) is in cell B5 and your Tax Rate (Tc) is in B6, the formula is nice and simple: =B5 * (1 - B6). This is a critical step. The tax-deductibility of interest payments effectively lowers the true cost of debt for the company.
Now you need the total value of the company's financing—the sum of its equity and debt. If the Market Value of Equity (E) is in cell B7 and Debt (D) is in B8, the formula is a straightforward =B7 + B8.
You're now set to calculate the weights for equity and debt.
- Weight of Equity:
=B7 / (B7 + B8) - Weight of Debt:
=B8 / (B7 + B8)
Here's a quick sanity check I always include: these two weights must add up to 100%. I'll usually add a small check formula right below them (=SUM(Weight_Equity_Cell, Weight_Debt_Cell)) just to be certain.
Bringing It All Together with the Final WACC Formula
You’ve got all the pieces. The last step is to assemble them into the final WACC formula in a single, clearly labelled "Result" cell. This formula will simply reference the intermediate calculations you just built.
The complete WACC formula in your Excel sheet will look something like this:
= (Weight_of_Equity * Cost_of_Equity) + (Weight_of_Debt * After-Tax_Cost_of_Debt)
Because you've referenced the cells from your "Calculations" section, your model is now dynamic. If you need to change an input—say, an updated Beta or a new corporate tax rate—your final WACC figure will update instantly.
Pro Tip: Make your formulas more intuitive with Excel's "Named Ranges" feature. Instead of a formula like
=(B11*B9)+(B12*B10), you could write=w_Equity*Re + w_Debt*Rd_AfterTax. It's a small change that makes your model infinitely easier for anyone to read and troubleshoot.
This level of precision is vital in major financial centres. Take Luxembourg, where the financial sector relies heavily on accurate WACC calculations for investment appraisal. The country's assets under management ballooned from €2,120 billion in 2011 to €2,646 billion in 2018, a surge that underscores the need for reliable financial modelling. For smaller teams, mastering a WACC model in Excel is a powerful way to evaluate financing options and support scaling operations. You can discover more insights about Luxembourg's financial sector growth in their detailed reports.
Putting Your WACC Model to Work: A Real-World Example
Alright, theory is one thing, but let's get our hands dirty and see how this works in practice. We'll walk through a complete WACC calculation in Excel for a small, privately held consulting agency. This is a super common scenario, especially if you're a freelancer or small business owner looking to make smarter investment decisions.
Let's imagine a fictional company called "Innovate Consulting." They're thinking about buying a new project management software suite that costs €15,000. To figure out if this is a good move, the owner needs their WACC to use as a hurdle rate. The agency’s finances are straightforward: the owner's initial investment is the equity, and they have a small business loan for debt.
Sourcing the Data
First things first, we need to round up our inputs. Since Innovate Consulting is a private company, we'll have to make some educated estimations based on public data. It's a bit of an art and a science.
Here are the assumptions we'll run with:
- Market Value of Equity (E): Based on recent earnings and what similar businesses are worth, the owner estimates the agency's value at €100,000.
- Market Value of Debt (D): They have an outstanding small business loan of €25,000.
- Cost of Debt (Rd): The interest rate on their loan is a simple 5%.
- Corporate Tax Rate (Tc): In Luxembourg, the applicable rate is 24.94%.
- Risk-Free Rate (Rf): We’ll peg this to the yield on a 10-year Luxembourg government bond, currently sitting at 2.8%.
- Equity Risk Premium (ERP): A standard figure of 5.5% is a reasonable assumption for a developed European market.
- Beta (β): This is the tricky one for a private firm. The best approach is to find a proxy. We'll use a Beta of 1.2 from a publicly traded professional services firm, which reflects a bit more volatility than the market as a whole.
Now that we've organised our inputs, we can jump into the spreadsheet.
Building the Calculation in Excel
Inside our Excel model, it's best to calculate each piece of the puzzle separately before putting it all together in the final WACC formula.
First up, the Cost of Equity (Re) using the CAPM formula:
Re = 2.8% + 1.2 * 5.5% = 9.4%
Next, let's figure out the After-Tax Cost of Debt, which is where we get our tax shield benefit:
Rd * (1-Tc) = 5% * (1 - 0.2494) = 3.75%
With the costs sorted, we need to know how much each source of capital contributes to the total pot. The total capital (E + D) is €100,000 + €25,000 = €125,000.
- Weight of Equity (E/V): €100,000 / €125,000 = 80%
- Weight of Debt (D/V): €25,000 / €125,000 = 20%
The final WACC is simply the blended, weighted average of these two capital sources. Think of it as the minimum return Innovate Consulting has to earn from its projects just to keep its owner and its lender happy.
Now, we combine everything to get our WACC:
WACC = (80% * 9.4%) + (20% * 3.75%) = 7.52% + 0.75% = 8.27%
So, Innovate Consulting's WACC is 8.27%.
This number is powerful. It tells the owner that the new software investment absolutely must generate a return higher than 8.27% to add any real value to the business. This figure is a cornerstone of any good Discounted Cash Flow analysis. To see how WACC slots into that bigger picture, check out our guide on building a discounted cash flow model.
Advanced WACC Techniques and Common Pitfalls to Avoid
Once you've got the basic WACC formula down, you'll find that real-world capital structures are rarely so simple. Businesses often use more than just common stock and debt, and your Excel model needs to reflect that reality.
A common addition you'll run into is preferred stock. Think of it as a hybrid—it has features of both debt (fixed payments) and equity. If a company has preferred shares, you can't just ignore them. You'll need to add a third component to your WACC formula, calculating the weight and cost of preferred stock alongside everything else. It adds a step, but it makes your final number much more accurate.
Another technique you'll definitely need for valuation work is unlevering and relevering Beta. This sounds complex, but the concept is straightforward. It’s the go-to method when you need to value a private company or a project that doesn't have a publicly-traded equivalent. You essentially "borrow" the Beta from a similar public company, strip out the effect of their debt to get a pure, or unlevered, Beta, and then apply your company's debt structure to it. This gives you a much more relevant Beta for your cost of equity calculation.
Navigating Common Spreadsheet Errors
Building the model is one thing; getting it right is another. Even seasoned analysts can get tripped up by simple spreadsheet errors that throw the whole calculation off. When you first start to calculate WACC in Excel, it's easy to make a few common mistakes.
Here are a few classic blunders I've seen time and time again:
- Circular References: This is the dreaded endless loop where a formula refers back to its own cell. Excel usually throws up a warning, but it can be a headache to fix. The key is to trace your logic and make sure your inputs flow cleanly to your final output without doubling back.
- Incorrect Cell Formatting: This one is subtle but deadly. I’ve seen models where a cost of debt of 5.0% was accidentally formatted as a general number, showing up as 500 and completely blowing up the WACC. Always, always double-check that your cells are formatted properly—percentages as percentages, currency as currency.
- Negative Book Value of Equity: This can happen if a company has a history of losses. When the book value of equity is negative, it's completely useless for weighting purposes. In this scenario, you must switch to using the market value of equity. No exceptions.
Remember, the WACC is a forward-looking measure. It's meant to estimate the cost of raising new capital. That's why you should always use market values over book values and the company's marginal tax rate, not its historical effective rate.
This forward-looking mindset is everything. For instance, recent data out of Luxembourg showed the current account surplus hitting €11.8 billion after a 6.5% jump in services trade. For an analyst in that market, building a WACC model would mean using relevant, current inputs like a 4.23% equity risk premium for Aaa-rated Luxembourg to accurately discount future cash flows. Getting familiar with regional economic indicators and their implications provides crucial context for your inputs.
A truly solid model is built on sound financial reasoning, not just correct formulas. WACC is a key part of the bigger picture, often used alongside performance metrics like Earnings Before Depreciation, Interest, and Tax. To see how they fit together, check out our complete guide to EBITDA.
Diving Into Common WACC Questions
Once you get your hands dirty building a WACC model in Excel, you’ll quickly find that the real world throws you a few curveballs. Spreadsheets like clean inputs, but business is rarely that tidy. Let's walk through some of the questions that almost always come up.
Getting these details right is what separates a theoretical calculation from a truly useful financial tool.
What If My Company Is a Startup With No Debt?
This is a classic one. How do you calculate a weighted average when there’s only one component? Simple: you don’t. If a startup is funded entirely by equity, its capital structure is 100% equity.
In this scenario, your WACC is just your cost of equity. The real challenge, however, is figuring out that cost. Without any trading history, you can’t calculate a historical Beta. Instead, you have to rely on industry comparables and add a significant premium for the startup's inherent risk. It’s not uncommon to use a Beta of 2.0 or even higher to reflect this uncertainty.
Is My WACC "Good"?
People always want to know if their final WACC number is "good," but there's no universal benchmark. A "good" WACC is all about context. A regulated utility company, with its predictable cash flows, might have a WACC around 4-6%. On the other hand, a fast-growing, volatile tech company could easily see a WACC of 10-12% or more.
Think of your WACC as the company's financial hurdle rate. Any investment or project needs to generate a return higher than the WACC to be considered value-additive. If the return is lower, the project is effectively costing the company money.
A great way to sanity-check your result is to look up WACC benchmarks for your specific industry. If your number is wildly different, it’s a good signal to double-check your inputs.
How Often Should I Recalculate WACC?
Your WACC is a snapshot of a specific moment and can go stale surprisingly fast. It’s not something you calculate once and then forget about.
Best practice is to update your WACC at least once a year. More importantly, you should run the numbers again whenever a major financial event occurs.
A few key triggers should prompt an immediate recalculation:
- Big swings in interest rates: Central bank rate changes will directly affect your risk-free rate and cost of debt.
- Changes to your capital structure: Issuing a large chunk of new shares or taking on a major loan will throw off your debt and equity weights.
- Significant stock price volatility: A dramatic change in your stock's trading patterns will alter its Beta, a key input for your cost of equity.
Keeping your WACC calculation fresh ensures your strategic decisions are based on the most accurate and current data possible.
Chasing invoices shouldn't take more time than doing the work itself. Billzy is a simple invoice tracking tool that helps you get paid faster, without the headache of spreadsheets. See what's paid, pending, and overdue at a glance. Start your $3 trial today.
Ready to Get Paid Faster?
Create professional invoices and track payments in seconds with Billzy.
Start Free Today